It's been my experience that BIRT reports can either look good in HTML or in PDF, but not both. Instead of trying to find the happy medium that makes both formats look passable, I've using the hide element feature to conceal the output for different formats. The two main offenders that look good in HTML but lousy in PDF are charts and cross tabs. With charts, I'm always tryign to squeeze as much data into the size of the screen so I make the chart as big as possible. However, when exported to pdf, you are limited by the paper size. Paper is in most cases smaller than a monitor. Cross tabs can be problematic because the size can be variable depending on parameter entry.
Also, there are cases where a report is comprised solely of a chart element that does some sort of summary of data, but users still want to get the underlying detail made available to them in an excel format. Savvy users will start doing their own analysis of the data using excel pivot tables or dump the data into an Access database and eventually I can incorporate whatever analysis they are doing into the logic of the report.
So, in summary, we can use the hide element feature to (1) make graphically unattractive data look good when exported and/or (2) provide more data to the user than what's apparent in the report.
In an example, let's say I have a report that has a header with a image and a title. Then I have a cross tab, and a table. When exported to excel, the header, the cross tab and the table will all have different row/column structures, which looks lousy in excel. So I'll set the header and cross tab to be hidden in format = excel, but visible in html. Then I'll leave the table visible in excel. When the report is run and exported to excel, I should get a clean, flat table with no extraneous features. Savvy users will create their own pivot tables, or sub-totaled sheets to get the answers they need.
In another example, let's say I have a chart that summarizes phase count by month per building. That's great, but some users may want to get a different view on similar data, such as phase count by month per facility. You can make the data available to the user by creating a second data set with more columns, driven by the same parameters as the chart data set. Create a table from this data set. Set the chart to be visible only in html and set the table to be invisible in html. Make the table visible only for excel.
Another example may be that you have two side by side charts to take advantage of the relative width of a monitor that when exported to paper is cramped, too small or maybe even truncated. You could create two versions of the the two charts in the report, one where the charts are side by side, and one where they are one on top of another. Set the first two to be visible in html only and the second two to be visible in pdf only.
It does take the report a little longer to run when their are multiple elements. The last report I mentioned with the duplicate charts is now taking 50 seconds to run, which is not acceptable in my mind. The charts also have a lot of mouse over tool tips that may add to the overhead required to generate the report. I haven't teased it apart yet to figure out what's causing the lag.
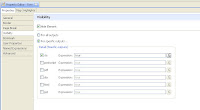
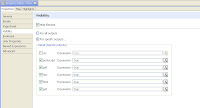
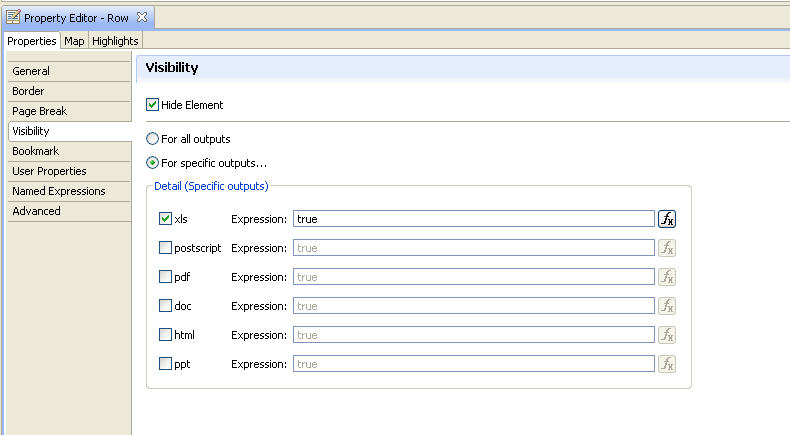
I'll get some pictures up on how to config the hiding when I get a chance.