if(Total.count() <1){true}
Showing posts with label BIRT reports. Show all posts
Showing posts with label BIRT reports. Show all posts
Wednesday, March 7, 2012
Table Visibility
When you want to hide a whole table if there is no data in the dataset, use this in visibility:


Friday, July 9, 2010
Display Report Elements Based on Parameter Selection

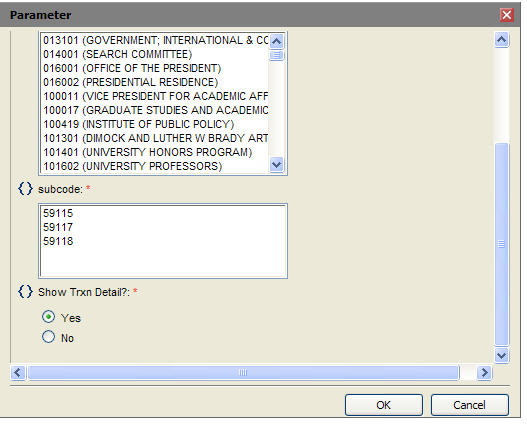
Extending the capabilities described in my last post, you can also allow the user to decide whether to display report elements at run time. Create a parameter with static values of Y and N (with display values of Yes and No). Then in visibility select hide element for html and then use the expression builder to reference the parameter. If your parameter is something like 'Show Transaction Detail?' then the following expression will hide it when N is selected.
BirtComp.equalTo(params["show_detail"].value,'N')
BirtComp.equalTo(params["show_detail"].value,'N')
In this case, I named my parameter show_detail.
Thursday, July 8, 2010
Displaying Report Elements Based On Output Format
It's been my experience that BIRT reports can either look good in HTML or in PDF, but not both. Instead of trying to find the happy medium that makes both formats look passable, I've using the hide element feature to conceal the output for different formats. The two main offenders that look good in HTML but lousy in PDF are charts and cross tabs. With charts, I'm always tryign to squeeze as much data into the size of the screen so I make the chart as big as possible. However, when exported to pdf, you are limited by the paper size. Paper is in most cases smaller than a monitor. Cross tabs can be problematic because the size can be variable depending on parameter entry.
Also, there are cases where a report is comprised solely of a chart element that does some sort of summary of data, but users still want to get the underlying detail made available to them in an excel format. Savvy users will start doing their own analysis of the data using excel pivot tables or dump the data into an Access database and eventually I can incorporate whatever analysis they are doing into the logic of the report.
So, in summary, we can use the hide element feature to (1) make graphically unattractive data look good when exported and/or (2) provide more data to the user than what's apparent in the report.
In an example, let's say I have a report that has a header with a image and a title. Then I have a cross tab, and a table. When exported to excel, the header, the cross tab and the table will all have different row/column structures, which looks lousy in excel. So I'll set the header and cross tab to be hidden in format = excel, but visible in html. Then I'll leave the table visible in excel. When the report is run and exported to excel, I should get a clean, flat table with no extraneous features. Savvy users will create their own pivot tables, or sub-totaled sheets to get the answers they need.
In another example, let's say I have a chart that summarizes phase count by month per building. That's great, but some users may want to get a different view on similar data, such as phase count by month per facility. You can make the data available to the user by creating a second data set with more columns, driven by the same parameters as the chart data set. Create a table from this data set. Set the chart to be visible only in html and set the table to be invisible in html. Make the table visible only for excel.
Another example may be that you have two side by side charts to take advantage of the relative width of a monitor that when exported to paper is cramped, too small or maybe even truncated. You could create two versions of the the two charts in the report, one where the charts are side by side, and one where they are one on top of another. Set the first two to be visible in html only and the second two to be visible in pdf only.
It does take the report a little longer to run when their are multiple elements. The last report I mentioned with the duplicate charts is now taking 50 seconds to run, which is not acceptable in my mind. The charts also have a lot of mouse over tool tips that may add to the overhead required to generate the report. I haven't teased it apart yet to figure out what's causing the lag.
I'll get some pictures up on how to config the hiding when I get a chance.

Also, there are cases where a report is comprised solely of a chart element that does some sort of summary of data, but users still want to get the underlying detail made available to them in an excel format. Savvy users will start doing their own analysis of the data using excel pivot tables or dump the data into an Access database and eventually I can incorporate whatever analysis they are doing into the logic of the report.
So, in summary, we can use the hide element feature to (1) make graphically unattractive data look good when exported and/or (2) provide more data to the user than what's apparent in the report.
In an example, let's say I have a report that has a header with a image and a title. Then I have a cross tab, and a table. When exported to excel, the header, the cross tab and the table will all have different row/column structures, which looks lousy in excel. So I'll set the header and cross tab to be hidden in format = excel, but visible in html. Then I'll leave the table visible in excel. When the report is run and exported to excel, I should get a clean, flat table with no extraneous features. Savvy users will create their own pivot tables, or sub-totaled sheets to get the answers they need.
In another example, let's say I have a chart that summarizes phase count by month per building. That's great, but some users may want to get a different view on similar data, such as phase count by month per facility. You can make the data available to the user by creating a second data set with more columns, driven by the same parameters as the chart data set. Create a table from this data set. Set the chart to be visible only in html and set the table to be invisible in html. Make the table visible only for excel.
Another example may be that you have two side by side charts to take advantage of the relative width of a monitor that when exported to paper is cramped, too small or maybe even truncated. You could create two versions of the the two charts in the report, one where the charts are side by side, and one where they are one on top of another. Set the first two to be visible in html only and the second two to be visible in pdf only.
It does take the report a little longer to run when their are multiple elements. The last report I mentioned with the duplicate charts is now taking 50 seconds to run, which is not acceptable in my mind. The charts also have a lot of mouse over tool tips that may add to the overhead required to generate the report. I haven't teased it apart yet to figure out what's causing the lag.
I'll get some pictures up on how to config the hiding when I get a chance.


Wednesday, June 9, 2010
Nice Looking Date Parameters in Birt
When making a Birt report with parameters for a date range, I like to build data set(s) for the date parameter(s) from the same Aim table as the eventual results set. For example, if I'm reporting from the phase status table, (ae_p_pst_e), I'll select the dates for the parameter data set from that table. That way you don't have to build a bunch of static dates and your parameters always will match the data available in the table from which you are reporting.
select distinct convert(datetime, convert(varchar,dateadd(day,-datepart(day,ae_p_pst_e.status_date)+1,ae_p_pst_e.status_date), 101)) as starting_date,
right(convert(varchar, status_date, 106), 8) as display_name
from ae_p_pst_e
order by date desc
We generally look at results on a monthly basis, so to make sure I get all records, I have my start date with a datetime of the first second of the month and the ending date with the last second of the month. And because in Birt you can display one column as the display value and have another column as the data value, I also use a shortened date format that is a little more visually pleasing for the display.
In short, create a data set called start date. Here's your query.
select distinct convert(datetime, convert(varchar,dateadd(day,-datepart(day,ae_p_pst_e.status_date)+1,ae_p_pst_e.status_date), 101)) as starting_date,
right(convert(varchar, status_date, 106), 8) as display_name
from ae_p_pst_e
order by date desc
Then create a data set called end date. Here's that query.
Select distinct dateadd(ss,-1, convert(datetime, convert(varchar,(dateadd (mm,1,status_date - day (status_date)+2)-1), 101))) as ending_date,
right(convert(varchar, status_date, 106), 8) as display_name
from ae_p_pst_e
right(convert(varchar, status_date, 106), 8) as display_name
from ae_p_pst_e
Then create two report parameters called start date and end date. Within the config for each parameter, reference the respective data sets. Set the value column to the data set column with the last/first seconds format, and the display column to the more visually pleasing column. Set the sort to the display column and order descending to show the most recent dates at the top.
Then create your main data set. Maybe its something like
select * from ae_p_pst_e where status_date > ? and status_date < ?.
Create your two dataset parameters referencing the report parameters and let it rip. You'll have nice looking parameters that underneath are very specific in setting the limits of the month.


Friday, June 4, 2010
Report Item Visibility based on parameter
Birt allows users to hide data elements based on the parameter selection. For example, maybe you have a report with a chart at the top with a corresponding table at the bottom. You can allow the user to dictate whether the table would be visible.


Create a report parameter with static values of Y and N. Then select the report item (a table in this example) and select visibility in the properties editor.
In the check the hide element box and select the radio button "for all outputs". Click on the formula editor and paste in:
BirtComp.equalTo(params["Parameter_name"].value, 'N')
where Parameter_name is the name of your report parameter.
When the report is run, the user will be presented with a parameter that allows the user to hide or display the report item.


Multiple, Multi-Select Parameters

One limitation in Birt is the lack of a simple way to create multiple, multi-select parameters. What I mean by that is when you want to have parameters where the user can select more than one value for a parameter. This can be overcome by writing scripts that modify the query at runtime. There are two ways to do this, but one of them is much more powerful than the other, especially when you want to have multiple parameters.
Here's the first way and I think it is is an inferior solution compared to the second one described below. It's utility seems to be limited to reports with a single parameter. In this method, you write a query with no where clause. Create a report parameter. Make sure to click the Allow Multiple Values checkbox. In the screen shot below, I built the parameter off a data set from the database as opposed to hard-coding in the values.
Next, go to the dataset and click on the scripts tab. Set the drop-down box to 'Before Open'. Enter the following script with the appropriate modifications to match what you've named your parameter.
var endOfQuery = " WHERE workorder.proposal IN ('" + params["proposal"].replace(/,/g,"','") + "')";
this.queryText += endOfQuery;
Another way to view this would be:
var endOfQuery = " WHERE tablename.columnname IN ('" + params["parametername"].replace(/,/g,"','") + "')";this.queryText += endOfQuery;
This will append the where clause onto the end of the query. It may be possible to modify this script to accomodate additional where clauses. It's been a while since I used this method and I may have tried and failed or maybe I never tried it.
My current preferred method is to write the query, but to include the where clause. A script is still required, but write string variables in the where clause. The script replaces these strings with selected parameter values.
The where clause may be something like this:
where tablename1.columname1 in ('xxx') and tablename2.columname2 in ('yyy')
Here's the script.
this.queryText = this.queryText.replace("xxx",params["parameter1"].value.join("','" ))
this.queryText = this.queryText.replace("yyy",params["parameter2"].value.join("','" ))
where parameter1 refers to tablename1.columnname1 and parameter2 refers to tablename2.columname2
I like this for its simplicity and there doesn't seem to be a limitation on the number of parameters that you can have.
A note: no dataset parameter is required when this is used. 


Hyperlinks from a Birt Report to Aim
Since many, if not all, records in Aim have a unique URL, you can create hyperlinks from a Birt Report back to the Aim application. This avoids the tedious searches by typing in the work order number, for example. BIRT provides a Hyperlink Editor for the creation of links to other BIRT reports, external content, and bookmarks within the same report. In this section we see how to use hyperlinks to link to AIM application.
In Birt, build your report. Then select the particular field for which the hyperlink is to be applied. Click on the properties editor and choose hyperlink. Select Link to and the hyperlink editor is displayed. In the hyperlink editor, select URI. Click the Fx button on the right to open the Expression builder. Type the URL of the AIM application surrounded by double quotes and end by referring the unique value that will direct the hyperlink to the corresponding Aim record.
A couple examples:
"https://gwuapp.assetworks.com/fmax/screen/WO_VIEW?proposal=" + row ["PH_WORKORDER"]
"https://gwuapp.assetworks.com/fmax/screen/SC_INVOICE_VIEW?tranxNo=" + row ["tranx_no_con"]
To find the exact URL, you can see it Aim, by doing a search and then selecting a record. The URL that is displayed is the unique url associated with that record. From that you'll understand the basic format, and how you need to modify it as a dynamically constructed hyperlink in BIRT.


In Birt, build your report. Then select the particular field for which the hyperlink is to be applied. Click on the properties editor and choose hyperlink. Select Link to and the hyperlink editor is displayed. In the hyperlink editor, select URI. Click the Fx button on the right to open the Expression builder. Type the URL of the AIM application surrounded by double quotes and end by referring the unique value that will direct the hyperlink to the corresponding Aim record.
A couple examples:
"https://gwuapp.assetworks.com/fmax/screen/WO_VIEW?proposal=" + row ["PH_WORKORDER"]
"https://gwuapp.assetworks.com/fmax/screen/SC_INVOICE_VIEW?tranxNo=" + row ["tranx_no_con"]
To find the exact URL, you can see it Aim, by doing a search and then selecting a record. The URL that is displayed is the unique url associated with that record. From that you'll understand the basic format, and how you need to modify it as a dynamically constructed hyperlink in BIRT.


Wednesday, June 2, 2010
Drill Through from a primary BIRT report to a secondary BIRT report
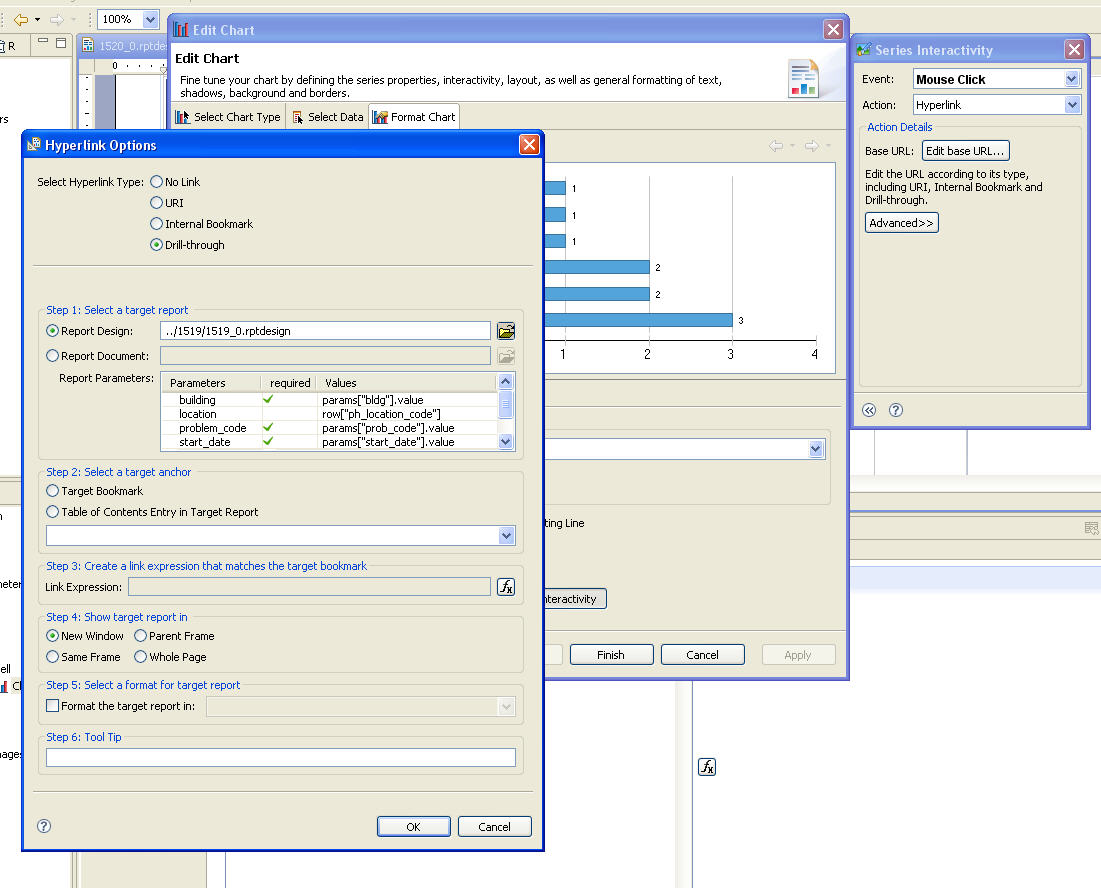
You can use the interactive features of BIRT to allow the user to click through/hyperlink from a primary report to a secondary report.
Because both reports will eventually in the AiM document repository, a certain sequence must be followed when creating the links between the two reports.
First, draft the primary report. Then draft the secondary report. Place the secondary report into the document repository. The document repository is comprised of a bunch of folders with names like 1341 and 1342. Inside the 1341 folder will be a document titled 1341_0. In order to have link between the two reports that will work on your desktop during development and in production on the AiM server, you need to create a relative path between the two reports similar to what would be found on the server.
Put the secondary (or target) report in the document repository. Note the tranx_num. On your desktop, create a folder in the same directory as the primary report. Name the folder with the tranx_num. Place the secondary report in the folder and rename it to the tranx_num, plus _0. It should be something like this (1341_0.rptdesign)
Now go to the primary report and create the linkage using the interactivity/hyperlink features in BIRT.
Because both reports will eventually in the AiM document repository, a certain sequence must be followed when creating the links between the two reports.
First, draft the primary report. Then draft the secondary report. Place the secondary report into the document repository. The document repository is comprised of a bunch of folders with names like 1341 and 1342. Inside the 1341 folder will be a document titled 1341_0. In order to have link between the two reports that will work on your desktop during development and in production on the AiM server, you need to create a relative path between the two reports similar to what would be found on the server.
Put the secondary (or target) report in the document repository. Note the tranx_num. On your desktop, create a folder in the same directory as the primary report. Name the folder with the tranx_num. Place the secondary report in the folder and rename it to the tranx_num, plus _0. It should be something like this (1341_0.rptdesign)
Now go to the primary report and create the linkage using the interactivity/hyperlink features in BIRT.
Fastest way to do this is to create the reports in Birt first without the linkages between the reports, the put the reports into Aim, create the corresponding folders on your desktop to create the relative file structure and THEN create the interactivity. If you find yourself having already created the linkages, you'll have to rebuild them once you get the file structure established.
Update: Since 5.0, there are some changes to the doc repo that affect how drill throughs function. First, I did the drill through hyperlink as url as opposed to a path described above. Maybe it works with path as well, but I was more comfortable with url.
First create both the reports with no hyperlinks/drill throughs. Name them something like primary and secondary to keep it straight. For the secondary report, create report parameter(s) that you intend to pass data to from the primary report. Make the parameters required. Place that report into Aim via report manager and run it to make sure it works. When you run the report, copy the url and paste it into notepad.
It should be something like:
https://gwuapp.assetworks.com:8443/reportviewertest/frameset?__fmaxDocId=0EE1E3FC-D340-45A4-ACA8-87C999166CAF&__fmaxReportId=1094&ph_shop=WC14
where ph_shop is the parameter value and everything up that refers to the report manager and doc repo.
Go to the primary report. Select the field that will be your hyperlink/drill through. Select hyperlink in properties. Select URI in the next radio button. Then bring up the expression builder. You are going to build a javascript expression to describe the target report.
Paste the copied url from notepad into the window. Put a double quotes at the begining and delete the parameter value string (like WC14 in the example) and put double quotes at the end.
Then add a + and select the row value corresponding the hyperlink.
Should look like this:
"https://gwuapp.assetworks.com:8443/reportviewertest/frameset?__fmaxDocId=0EE1E3FC-D340-45A4-ACA8-87C999166CAF&__fmaxReportId=1094&ph_shop="+row["ph_shop"]
Load the primary report into Aim report manager. Run it and test.
Update: Since 5.0, there are some changes to the doc repo that affect how drill throughs function. First, I did the drill through hyperlink as url as opposed to a path described above. Maybe it works with path as well, but I was more comfortable with url.
First create both the reports with no hyperlinks/drill throughs. Name them something like primary and secondary to keep it straight. For the secondary report, create report parameter(s) that you intend to pass data to from the primary report. Make the parameters required. Place that report into Aim via report manager and run it to make sure it works. When you run the report, copy the url and paste it into notepad.
It should be something like:
https://gwuapp.assetworks.com:8443/reportviewertest/frameset?__fmaxDocId=0EE1E3FC-D340-45A4-ACA8-87C999166CAF&__fmaxReportId=1094&ph_shop=WC14
where ph_shop is the parameter value and everything up that refers to the report manager and doc repo.
Go to the primary report. Select the field that will be your hyperlink/drill through. Select hyperlink in properties. Select URI in the next radio button. Then bring up the expression builder. You are going to build a javascript expression to describe the target report.
Paste the copied url from notepad into the window. Put a double quotes at the begining and delete the parameter value string (like WC14 in the example) and put double quotes at the end.
Then add a + and select the row value corresponding the hyperlink.
Should look like this:
"https://gwuapp.assetworks.com:8443/reportviewertest/frameset?__fmaxDocId=0EE1E3FC-D340-45A4-ACA8-87C999166CAF&__fmaxReportId=1094&ph_shop="+row["ph_shop"]
Load the primary report into Aim report manager. Run it and test.
Subscribe to:
Posts (Atom)