Showing posts with label Interactivity. Show all posts

Saturday, August 7, 2010

Interactive Birt Chart Output Formats - Which one do you use?

If you're thinking about making some cool charts for your Birt reports, one of the first decisions you'll have to make is which output format to use. The choices are PNG, JPG, BMP, SVG. If the report doesn't need to feature any interactive features, you could pick JPG or BMP. To take advantage of the interactive features of Birt, you'll need to choose between PNG or SVG. And that's where things get a little more complicated, because different browsers render the interactive features of PNG and SVG differently. Also, some interactive features work differently in SVG than PNG.

First, read up on PNG and SVG on Wikipedia to get a little background. One of the things you'll find out is that SVG is not supported by IE 8 and only marginally by IE 9. However, I've noticed that some Birt interactive chart features don't work even in browsers that 'support' SVG. There is an adobe plug-in for IE that allows it to support SVG, but I'd like to avoid plug-ins if possible. Read more about browser support for SVG here, where some saint is documenting the results of performing 280 different tests on every known web browser.

For the reasons described above, I started using PNG. There were a couple cool interactive features that were supported by PNG, but it seemed like the best fit.

So here are the features I like best. I like to show tooltips on Mouse Over. This will allow some additional data to show up in a little window when the user hovers the mouse pointer over a data point. I find this useful because it's always a challenge to fit everything on the chart and this is a way to make the chart as big as possible while still allowing the user to get some more contextual information. As an example, let's say the y-axis is ae_s_bld_c.bldg, which is a building number or address. Because not all your users can quickly perform the mental translation from building number/address to building description, you could flash the more commonly known building description as a tool tip.

Another application for the tooltips would be when a chart has been made that normalizes the data based on percentage and you could use the tool tip to show the actual count of work orders, for example. You could also stitch a couple of these together into the same tool tip.

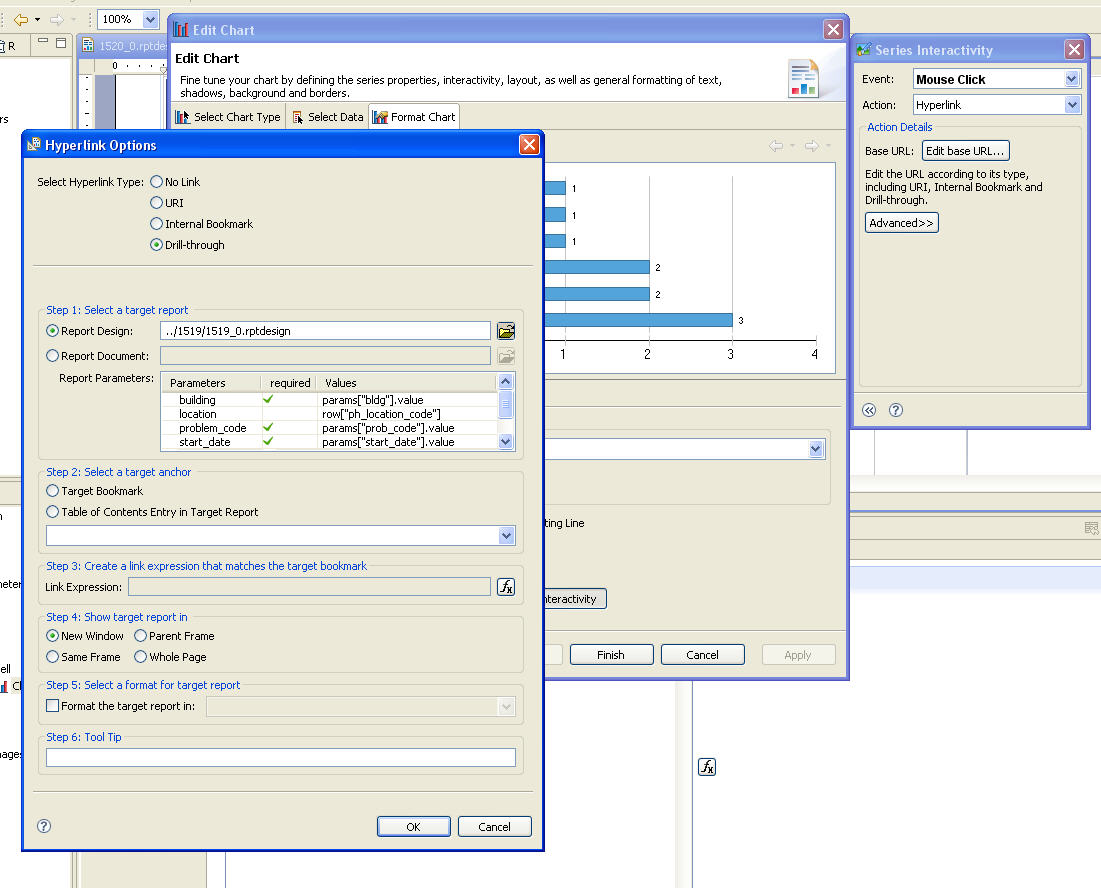
The other feature that I really like is hyperlink. You can drill-through from the chart report to another chart report or text report or right into a browse or individual record in the Aim application. You can see another article that I've written on that topic here.

I'll get some pictures up when I get a chance, plus some examples of the tooltips and hyperlinks code.





Wednesday, June 2, 2010

Drill Through from a primary BIRT report to a secondary BIRT report


You can use the interactive features of BIRT to allow the user to click through/hyperlink from a primary report to a secondary report.

Because both reports will eventually in the AiM document repository, a certain sequence must be followed when creating the links between the two reports.

First, draft the primary report. Then draft the secondary report. Place the secondary report into the document repository. The document repository is comprised of a bunch of folders with names like 1341 and 1342. Inside the 1341 folder will be a document titled 1341_0. In order to have link between the two reports that will work on your desktop during development and in production on the AiM server, you need to create a relative path between the two reports similar to what would be found on the server.

Put the secondary (or target) report in the document repository. Note the tranx_num. On your desktop, create a folder in the same directory as the primary report. Name the folder with the tranx_num. Place the secondary report in the folder and rename it to the tranx_num, plus _0. It should be something like this (1341_0.rptdesign)

Now go to the primary report and create the linkage using the interactivity/hyperlink features in BIRT.

Fastest way to do this is to create the reports in Birt first without the linkages between the reports, the put the reports into Aim, create the corresponding folders on your desktop to create the relative file structure and THEN create the interactivity. If you find yourself having already created the linkages, you'll have to rebuild them once you get the file structure established.

Update: Since 5.0, there are some changes to the doc repo that affect how drill throughs function. First, I did the drill through hyperlink as url as opposed to a path described above. Maybe it works with path as well, but I was more comfortable with url.

First create both the reports with no hyperlinks/drill throughs. Name them something like primary and secondary to keep it straight. For the secondary report, create report parameter(s) that you intend to pass data to from the primary report. Make the parameters required. Place that report into Aim via report manager and run it to make sure it works. When you run the report, copy the url and paste it into notepad.

It should be something like:
https://gwuapp.assetworks.com:8443/reportviewertest/frameset?__fmaxDocId=0EE1E3FC-D340-45A4-ACA8-87C999166CAF&__fmaxReportId=1094&ph_shop=WC14

where ph_shop is the parameter value and everything up that refers to the report manager and doc repo.

Go to the primary report. Select the field that will be your hyperlink/drill through. Select hyperlink in properties. Select URI in the next radio button. Then bring up the expression builder. You are going to build a javascript expression to describe the target report.

Paste the copied url from notepad into the window. Put a double quotes at the begining and delete the parameter value string (like WC14 in the example) and put double quotes at the end.

Then add a + and select the row value corresponding the hyperlink.

Should look like this:
"https://gwuapp.assetworks.com:8443/reportviewertest/frameset?__fmaxDocId=0EE1E3FC-D340-45A4-ACA8-87C999166CAF&__fmaxReportId=1094&ph_shop="+row["ph_shop"]

Load the primary report into Aim report manager. Run it and test.