Friday, June 22, 2018

Create comma separated list from table column data

I made a report to show assets that weren't on the appropriate PM template and to make it easy to add the exact assets on the PM template phase screen, I wanted to convert column data into a single array or comma separated list. I did some research and cobbled together a couple online examples to solve the problem. 

On the data set beforeOpen script:

footlist = "";

On the data set beforeOpen script:

foolist +=row['asset_tag'] + ", ";

On the layout, I added a dynamic text following the table:

foolist=foolist.replace(/,\s*$/, "");
foolist;

Here is how it looks in the report designer.
Here is how it looks on the report. That list can be copied and pasted into the template phase to search for assets. This is especially helpful if you have a template requiring multiple asset classifications in multiple buildings as it defines the exact list of assets. 

This approach could also be used for building lists of shop people to search for daily assignments to compose a url. 

Tuesday, December 1, 2015

Concatenating rows of data into a single row

I wanted to create a report that would feature a hyperlink to AiM daily assignment browse screen that required a "in" operator with comma seperated values. I made a separate data set that looked up all the shop people for a particular shop and then used the following script to concatenated the rows into a single row, separated by the URL encode for a comma so that I could make a dynamic hyperlink to the daily assignment browse. 

Here's the script:
DECLARE @Txt1 VARCHAR(MAX)
DECLARE @shop varchar (20)
SET @Txt1=''
SET @shop='WC03' 
SELECT  @Txt1 = @Txt1 + shop_person +'%2C'
FROM    ae_l_shp_d  
where shop=@shop and date_to is null
SELECT  @shop as shop, LEFT(@Txt1,LEN(@Txt1)-3) AS shop_person

So instead of getting data like this:

 I get data that looks like this:


I used the hyperlink editor to dynamically build my hyperlink with these values.

Similarly, I converted sql datetime to URL date time using this script. 

select convert(varchar, GW_OPENS_DONES.dates, 23) + '%2000%3A00%3A00.0' as url_date
to make values like this:2015-11-11%2000%3A00%3A00.0

Wednesday, March 7, 2012

Table Visibility

When you want to hide a whole table if there is no data in the dataset, use this in visibility:
if(Total.count() <1){true}


Friday, March 18, 2011

Removing Hyperlinks from null values in a Birt Cross Tab

When you use dynamic hyperlinks from a cross tab that has some null values in the cells, with a slight javascript modification to your hyperlink, you can hide all the little blue underscores in the cells with no values.

if (data["count_Building/bldg_Work Code/craft_code"]!= null) {"https://gwuapp.assetworks.com/fmax/screen/SC_BROWSE?aeSCtrE.contractor="+data["contractor"]+"&aeSCtrE.statusCode="+data["status_code"]"}

or

if (summary data row!= null) {"hyperlink"}

Thursday, March 10, 2011

Problems with "ANY" data types in Birt 2.5.1

We recently had a performance issue with the Aim application that was attributed to "ANY" data types in some of our Birt reports. Apparently, Birt prefers data types other than "ANY" such as string, integer, etc. A review of all 73 of our custom reports indicated that "ANY" data types occurred in computer data set columns and parameters. Best way to track these down is to look at your data sets in the output columns screen and in the parameter set up. As a final check, do a text search for "ANY" in the xml. We found cases where the parameter was set to string, but was any in the xml. Thanks to Greg Williams for going through all 73 of the reports.

Thursday, January 27, 2011

Cascading Date Range Parameters

I've written about date range parameters in an earlier post. In that post I wrote about using a group-by month sql query to dynamically create parameter lists. As I used the technique for a while, I noticed an irritating flaw. Because the two parameters were independent of each other, it was possible to request an end date that was before the start date, which generated 0 records when the report was run. Had to be a better way. I knew about cascading parameters, but found that their use was too limiting for the reports I like to create. But maybe I could use them to make a better date range parameter.

So using the technique described in the earlier post, I made two data sets, one called begin date and one called end date.

Begin date has a query like:

select distinct convert(datetime, convert(varchar,dateadd(day,-datepart(day,ae_s_fnd_a.tranx_date)+1,ae_s_fnd_a.tranx_date), 101)) as starting_date,
right(convert(varchar, ae_s_fnd_a.tranx_date, 106), 8) as display_name
from ae_s_fnd_a

end date has a query like:

Select distinct dateadd(ss,-1, convert(datetime, convert(varchar,(dateadd (mm,1,ae_s_fnd_a.tranx_date - day (ae_s_fnd_a.tranx_date)+2)-1), 101))) as ending_date,
right(convert(varchar, ae_s_fnd_a.tranx_date, 106), 8) as display_name
from ae_s_fnd_a
where ae_s_fnd_a.tranx_date > ?

Then make a cascading parameter, with the first parameter called begin date. Make it a list box, dynamically created, and reference the begin date data set. Set it to order descending by starting date.

Then add another parameter called end date. Reference the end date data set. Everything else same as above.

Then go back to your end date data set. Create a data set parameter referencing the begin date report parameter.

End result is that your end date parameter will be filtered by dates AFTER your start date. So you just cant pick a date BEFORE your start date.

Tuesday, December 21, 2010

Hyperlink to a new email off Birt Report

I made a series of contact list reports off the Human Resources module for use as a phone/email directory and I wanted to make the email addresses hyperlinked so that the default email application would start an email when the address was clicked off the report.


Make a text field in the email column of your table. Set type to html.
I tried to punch the code into the body of my post, but the browser is reading it as html and not showing all the code, so check out the image for the code.

Monday, December 20, 2010

Creating Birt Sub-Reports Using Dataset Parameter Binding

I'm going to write about a feature that I only recently discovered and wished I knew about a long time ago. The concept is how to do sub-reporting and neatly tie the master value with sub-reports using something called dataset parameter binding.

For example, let's say I have a master record like a service contract, and I want to report all the associated invoices associated to the service contract.

I have a primary dataset of service contracts, and a secondary dataset of invoices.

Make a table for service contract. Inside the detail row of the service contract table, place another table for invoice data.

Create a dataset parameter in the invoice dataset. It is not tied to a report parameter, so you are forced to choose a default value. Go ahead and do this even though it seems weird.

Then go to your invoice table. Select binding and click on dataset parameter binding. Edit the existing binding by identifying the corresponding dataset row from the contract table. This ties the outer table to the inner table.

Once you get this simple example you can expand the concept. I made a dashboard for shop supervisors a combination of 5 charts and tables all using dataset parameter binding that works great in the Aim Workdesk.

Tuesday, October 26, 2010

Alternative Row Highlighting in Birt

To improve readability of a list report, alternative row highlighting can be applied to the detail row of a table. Select the entire row, and then click on the Highlighting Tab in the Property Editor. Click Add and then paste the following text

row.__rownum %2


into the "if the following condition is true field". Set the next field to equal to and then put a 0 into the last field. Then down at the bottom, select "background color" and pick out a LIGHT grey color. You'll be presented with basic colors, but I like to pick a custom lighter grey because it prints better.


Tuesday, August 10, 2010

Nice looking Percents on Mouse-Over Chart Interactivity in Birt

If you're incorporating a mouse-over interactive feature in a Birt Chart and your data point is a percent, the resulting data flash can look sort of ugly (like 0.021200). You can control this by editing the format of the tooltip text.

a = row["PERCENT_CLOSED"]
a = a.toPrecision(2)*100
a = a+'%'

This should result in the percentage being displayed at as 21% as opposed to 0.021200. Occasionally I get some strange results like 21.0000004% that I can't really explain.

Saturday, August 7, 2010

Interactive Birt Chart Output Formats - Which one do you use?

If you're thinking about making some cool charts for your Birt reports, one of the first decisions you'll have to make is which output format to use. The choices are PNG, JPG, BMP, SVG. If the report doesn't need to feature any interactive features, you could pick JPG or BMP. To take advantage of the interactive features of Birt, you'll need to choose between PNG or SVG. And that's where things get a little more complicated, because different browsers render the interactive features of PNG and SVG differently. Also, some interactive features work differently in SVG than PNG.

First, read up on PNG and SVG on Wikipedia to get a little background. One of the things you'll find out is that SVG is not supported by IE 8 and only marginally by IE 9. However, I've noticed that some Birt interactive chart features don't work even in browsers that 'support' SVG. There is an adobe plug-in for IE that allows it to support SVG, but I'd like to avoid plug-ins if possible. Read more about browser support for SVG here, where some saint is documenting the results of performing 280 different tests on every known web browser.

For the reasons described above, I started using PNG. There were a couple cool interactive features that were supported by PNG, but it seemed like the best fit.

So here are the features I like best. I like to show tooltips on Mouse Over. This will allow some additional data to show up in a little window when the user hovers the mouse pointer over a data point. I find this useful because it's always a challenge to fit everything on the chart and this is a way to make the chart as big as possible while still allowing the user to get some more contextual information. As an example, let's say the y-axis is ae_s_bld_c.bldg, which is a building number or address. Because not all your users can quickly perform the mental translation from building number/address to building description, you could flash the more commonly known building description as a tool tip.

Another application for the tooltips would be when a chart has been made that normalizes the data based on percentage and you could use the tool tip to show the actual count of work orders, for example. You could also stitch a couple of these together into the same tool tip.

The other feature that I really like is hyperlink. You can drill-through from the chart report to another chart report or text report or right into a browse or individual record in the Aim application. You can see another article that I've written on that topic here.

I'll get some pictures up when I get a chance, plus some examples of the tooltips and hyperlinks code.


Friday, July 9, 2010

Display Report Elements Based on Parameter Selection


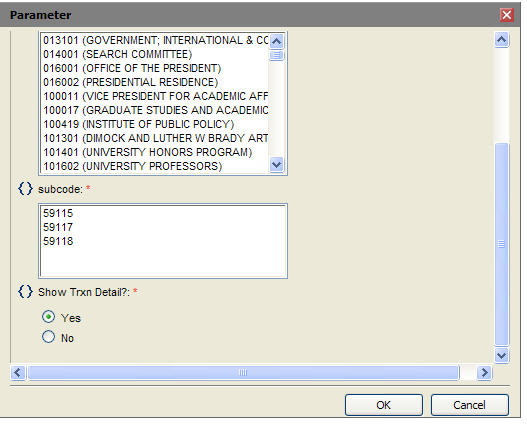
Extending the capabilities described in my last post, you can also allow the user to decide whether to display report elements at run time. Create a parameter with static values of Y and N (with display values of Yes and No). Then in visibility select hide element for html and then use the expression builder to reference the parameter. If your parameter is something like 'Show Transaction Detail?' then the following expression will hide it when N is selected.

BirtComp.equalTo(params["show_detail"].value,'N')
In this case, I named my parameter show_detail.

Thursday, July 8, 2010

Displaying Report Elements Based On Output Format


It's been my experience that BIRT reports can either look good in HTML or in PDF, but not both. Instead of trying to find the happy medium that makes both formats look passable, I've using the hide element feature to conceal the output for different formats. The two main offenders that look good in HTML but lousy in PDF are charts and cross tabs. With charts, I'm always tryign to squeeze as much data into the size of the screen so I make the chart as big as possible. However, when exported to pdf, you are limited by the paper size. Paper is in most cases smaller than a monitor. Cross tabs can be problematic because the size can be variable depending on parameter entry.

Also, there are cases where a report is comprised solely of a chart element that does some sort of summary of data, but users still want to get the underlying detail made available to them in an excel format. Savvy users will start doing their own analysis of the data using excel pivot tables or dump the data into an Access database and eventually I can incorporate whatever analysis they are doing into the logic of the report.

So, in summary, we can use the hide element feature to (1) make graphically unattractive data look good when exported and/or (2) provide more data to the user than what's apparent in the report.

In an example, let's say I have a report that has a header with a image and a title. Then I have a cross tab, and a table. When exported to excel, the header, the cross tab and the table will all have different row/column structures, which looks lousy in excel. So I'll set the header and cross tab to be hidden in format = excel, but visible in html. Then I'll leave the table visible in excel. When the report is run and exported to excel, I should get a clean, flat table with no extraneous features. Savvy users will create their own pivot tables, or sub-totaled sheets to get the answers they need.

In another example, let's say I have a chart that summarizes phase count by month per building. That's great, but some users may want to get a different view on similar data, such as phase count by month per facility. You can make the data available to the user by creating a second data set with more columns, driven by the same parameters as the chart data set. Create a table from this data set. Set the chart to be visible only in html and set the table to be invisible in html. Make the table visible only for excel.

Another example may be that you have two side by side charts to take advantage of the relative width of a monitor that when exported to paper is cramped, too small or maybe even truncated. You could create two versions of the the two charts in the report, one where the charts are side by side, and one where they are one on top of another. Set the first two to be visible in html only and the second two to be visible in pdf only.

It does take the report a little longer to run when their are multiple elements. The last report I mentioned with the duplicate charts is now taking 50 seconds to run, which is not acceptable in my mind. The charts also have a lot of mouse over tool tips that may add to the overhead required to generate the report. I haven't teased it apart yet to figure out what's causing the lag.

I'll get some pictures up on how to config the hiding when I get a chance.

Tuesday, June 29, 2010

Great Article on SQL grouping by time periods

This is a great article on grouping my month and has been the foundation for developing the base queries that I use for many BIRT reports that often have a date component. I wanted to give the author the credit he is due.

http://weblogs.sqlteam.com/jeffs/archive/2007/09/10/group-by-month-sql.aspx

Tuesday, June 15, 2010

Birt Reports on Aim Desktop - Trailing 13 months

One of the great features of Aim is the ability to display Birt reports on the workdesk. This gives report designers the ability to create a reporting dashboard showing one or more charts in a single BIRT report.

I like to show the trailing 13 complete months in chart reports that auto-load on the work desk so that the user can see the annual trend and the same month from the year prior. I riffed of the last second of the month sql discussed in my "nice looking date parameters" article to come up with the where clause for the chart dataset.

First, read up on the dateadd function here. http://www.w3schools.com/sql/func_dateadd.asp

Maybe there's a cleaner way to do this, but it works.

Here's a simple application:

select ph_workorder, ph_date_created
from phase
where ph_date_created > dateadd (m, -13, dateadd
(ss,-1, convert(datetime, convert(varchar,(dateadd (mm,1,getdate() - day (getdate())+2)-1), 101))) )
order by ph_date_created

Wednesday, June 9, 2010

Nice Looking Date Parameters in Birt

When making a Birt report with parameters for a date range, I like to build data set(s) for the date parameter(s) from the same Aim table as the eventual results set. For example, if I'm reporting from the phase status table, (ae_p_pst_e), I'll select the dates for the parameter data set from that table. That way you don't have to build a bunch of static dates and your parameters always will match the data available in the table from which you are reporting.

We generally look at results on a monthly basis, so to make sure I get all records, I have my start date with a datetime of the first second of the month and the ending date with the last second of the month. And because in Birt you can display one column as the display value and have another column as the data value, I also use a shortened date format that is a little more visually pleasing for the display.

In short, create a data set called start date. Here's your query.

select distinct convert(datetime, convert(varchar,dateadd(day,-datepart(day,ae_p_pst_e.status_date)+1,ae_p_pst_e.status_date), 101)) as starting_date,
right(convert(varchar, status_date, 106), 8) as display_name
from ae_p_pst_e
order by date desc

Then create a data set called end date. Here's that query.

Select distinct dateadd(ss,-1, convert(datetime, convert(varchar,(dateadd (mm,1,status_date - day (status_date)+2)-1), 101))) as ending_date,
right(convert(varchar, status_date, 106), 8) as display_name
from ae_p_pst_e

Then create two report parameters called start date and end date. Within the config for each parameter, reference the respective data sets. Set the value column to the data set column with the last/first seconds format, and the display column to the more visually pleasing column. Set the sort to the display column and order descending to show the most recent dates at the top.
Then create your main data set. Maybe its something like

select * from ae_p_pst_e where status_date > ? and status_date < ?.

Create your two dataset parameters referencing the report parameters and let it rip. You'll have nice looking parameters that underneath are very specific in setting the limits of the month.

Tuesday, June 8, 2010

Shortening long string fields and removing carriage returns


Inevitably, your users will want a work order list report. In AiM, the work order and phase description fields are up to 255 chars long, which can eat up a lot of space in the limited space available on your report. To avoid killing tons of trees every time a report is printed, there are a couple options to shorten the text passed to the report.

Starting in Birt 2.5, you can control in the report editor whether wrapping is allowed or not. This can be found in data or column advanced properties/text/whitespace. Set the value to "no wrapping". I've found this to be of limited value because it doesn't control carriage returns in the data and will continue to wrap on the carriage returns.


Another option is to control the text formatting in the sql query.

Use the sql command SUBSTRING to limit the number of characters retrieved from the database.

select
substring (ph_desc, 1, 60) as ph_desc
from phase

which means that 60 chars, starting with the first character, of the ph_desc field will be retrieved.

Then, AiM allows users to enter carriage returns and line feeds, so I do a couple more modifications to remove those since they can also eat up space.

--to remove carriage returns
select
replace (ph_desc, CHAR (13), ' ') as ph_desc
from phase

and/or

--to remove line feeds
select
replace (ph_desc, CHAR (10), ' ') as ph_desc
from phase

All of these can be combined in the following way.

select
replace (replace (substring(ph_desc,1,60), CHAR (13), ' '), CHAR(10), ' ') as ph_desc
from phase

Friday, June 4, 2010

Report Item Visibility based on parameter

Birt allows users to hide data elements based on the parameter selection. For example, maybe you have a report with a chart at the top with a corresponding table at the bottom. You can allow the user to dictate whether the table would be visible.

Create a report parameter with static values of Y and N. Then select the report item (a table in this example) and select visibility in the properties editor.

In the check the hide element box and select the radio button "for all outputs". Click on the formula editor and paste in:

BirtComp.equalTo(params["Parameter_name"].value, 'N')

where Parameter_name is the name of your report parameter.

When the report is run, the user will be presented with a parameter that allows the user to hide or display the report item.

Multiple, Multi-Select Parameters


One limitation in Birt is the lack of a simple way to create multiple, multi-select parameters. What I mean by that is when you want to have parameters where the user can select more than one value for a parameter. This can be overcome by writing scripts that modify the query at runtime. There are two ways to do this, but one of them is much more powerful than the other, especially when you want to have multiple parameters.


Here's the first way and I think it is is an inferior solution compared to the second one described below. It's utility seems to be limited to reports with a single parameter. In this method, you write a query with no where clause. Create a report parameter. Make sure to click the Allow Multiple Values checkbox. In the screen shot below, I built the parameter off a data set from the database as opposed to hard-coding in the values.

Next, go to the dataset and click on the scripts tab. Set the drop-down box to 'Before Open'. Enter the following script with the appropriate modifications to match what you've named your parameter.

var endOfQuery = " WHERE workorder.proposal IN ('" + params["proposal"].replace(/,/g,"','") + "')";
this.queryText += endOfQuery;

Another way to view this would be:

var endOfQuery = " WHERE tablename.columnname IN ('" + params["parametername"].replace(/,/g,"','") + "')";this.queryText += endOfQuery;

This will append the where clause onto the end of the query. It may be possible to modify this script to accomodate additional where clauses. It's been a while since I used this method and I may have tried and failed or maybe I never tried it.

My current preferred method is to write the query, but to include the where clause. A script is still required, but write string variables in the where clause. The script replaces these strings with selected parameter values.

The where clause may be something like this:

where tablename1.columname1 in ('xxx') and tablename2.columname2 in ('yyy')

Here's the script.

this.queryText = this.queryText.replace("xxx",params["parameter1"].value.join("','" ))
this.queryText = this.queryText.replace("yyy",params["parameter2"].value.join("','" ))

where parameter1 refers to tablename1.columnname1 and parameter2 refers to tablename2.columname2

I like this for its simplicity and there doesn't seem to be a limitation on the number of parameters that you can have.

A note: no dataset parameter is required when this is used.

Hyperlinks from a Birt Report to Aim

Since many, if not all, records in Aim have a unique URL, you can create hyperlinks from a Birt Report back to the Aim application. This avoids the tedious searches by typing in the work order number, for example. BIRT provides a Hyperlink Editor for the creation of links to other BIRT reports, external content, and bookmarks within the same report. In this section we see how to use hyperlinks to link to AIM application.

In Birt, build your report. Then select the particular field for which the hyperlink is to be applied. Click on the properties editor and choose hyperlink. Select Link to and the hyperlink editor is displayed. In the hyperlink editor, select URI. Click the Fx button on the right to open the Expression builder. Type the URL of the AIM application surrounded by double quotes and end by referring the unique value that will direct the hyperlink to the corresponding Aim record.

A couple examples:
"https://gwuapp.assetworks.com/fmax/screen/WO_VIEW?proposal=" + row ["PH_WORKORDER"]

"https://gwuapp.assetworks.com/fmax/screen/SC_INVOICE_VIEW?tranxNo=" + row ["tranx_no_con"]

To find the exact URL, you can see it Aim, by doing a search and then selecting a record. The URL that is displayed is the unique url associated with that record. From that you'll understand the basic format, and how you need to modify it as a dynamically constructed hyperlink in BIRT.